TOP TALK

Posted By Sue Parente on April 09, 2014
What counts as “news” from a PR perspective? Every company knows major episodic events like product launches, new client stories or business action such as an IPO or merger are newsworthy – but typically those events are few and far between. What other valuable insights can your company offer in the meantime to add depth and color to your ongoing brand story?
Surveys can offer your company a powerful way to leverage your existing assets, such as customer or social communities or proprietary expertise to address a broadly relevant question, trend or issue. Think about it: every company has cornered some specific area of knowledge or persona type. When the world has questions touching on that knowledge or group of people, the trick is positioning yourself as the go-to resource for answers.
Tier One has had considerable success with smart client surveying. Here's what we've learned along the way.
Mix Up Quantitative Results with Real-World “Color”
Statistics can offer crisp takes on a given trend, but don't forget to toss in a provocative free-response question now and then. Actual quotes from individuals give an illuminating window into what might otherwise feel like dry numbers. Your purpose with any survey is to 1) unearth surprises, 2) quantify them to confirm they're broadly relevant, and 3) pique the interest of reporters and bloggers. Individual quotes are helpful for accomplishing #3 on that list.
Anticipate the Press' Questions
Online brokerage client TradeKing started surveying its client base to address a recurring press question: what do individual investors think about X? We realized a quarterly client survey could provide a broad-based perspective on prevailing economic and market trends, while inviting reporters and bloggers to follow up for individual stories.
Since its inception several years ago, TradeKing's quarterly survey has garnered headlines with The Wall Street Journal, Barron's and many others. While not every company needs to commit to a recurring survey, for TradeKing it's been useful on multiple levels. Sometimes trends revealed via survey data are newsworthy and surprising. But the recurring nature of TradeKing's survey also serves as a reminder to media that TradeKing is able to help research questions of investor sentiment of any kind. We've fielded innumerable requests by media to connect with real-world investors, helping reporters while boosting TradeKing's brand awareness along the way.
Think Seasonal
Personal productivity app and Tier One client Springpad recently surveyed its users about obstacles getting in the way of their spring-cleaning. It also allowed them to tout the company's new Notebook Store, a collection of notebooks curated by industry experts to tame specific projects, from kitchen-organization to organizing a baby shower.
This strategy is designed to slot your company into broader trend stories already in the works. Every year, spring will come, tax season will hit, vacation-planning kicks into gear… how does your product address the next wave of seasonal needs?
Hitch Your Wagon to a Larger Event
When the world's eyes swivel to a particular event, ask yourself: what perspective does my company bring to this event that others aren't aware of? What do my paying customers (or, in the case of B2B companies, check-writing clients) want to know in light of this event?
College millennial marketing agency and Tier One client Fluent powers its brand campaigns with a 16,000-strong network of “student ambassadors” – a perfect audience for the college-millennial take on various trends. Fluent surveyed this group as part of USA Today's AdMeter coverage of the most recent Super Bowl; How to Reach Millennials With Your Super Bowl Ad was the result.
Fluent's client base consists of major brands spending considerable sums on consumer events like the Super Bowl, so this survey strikes at the heart of their interests – and captures prospective clients' attention.
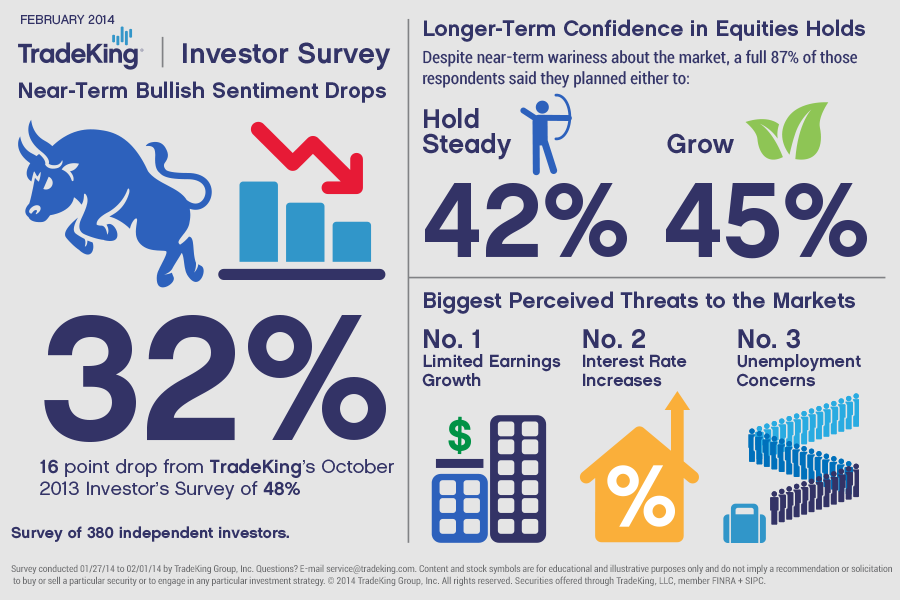
Visualize the Results
Where possible, make the most interesting stats from your survey visual in a shareable infographic or SlideShare presentation. Your infographic can “live” on multiple, visually driven social sites, from Pinterest to Instagram to Flickr to Facebook, and link to the full survey results. Don't hesitate to create multiple visuals, each encapsulating a single data point, so you can present different facets of your survey's findings. Check out this recent survey infographic from TradeKing:
Take inspiration from Fluent's holiday wishes video, the result of smart surveying just before Christmas:
We've only scratched the surface of how surveying can unlock news and insights specific to your company. The next time you share a news headline with a thought-provoking stat, ask yourself: what statistic captures a truth only your team knows, and the world would be eager to find out?
Want to get started with your own survey? Here are some great resources and tools:
Tools
Resources
- Survey Monkey: How many respondents do I need?
- Marketing Profs: Six Tips for Creating an Effective Online Customer Survey
- Mashable: 5 Tips for Creating an Online Survey